
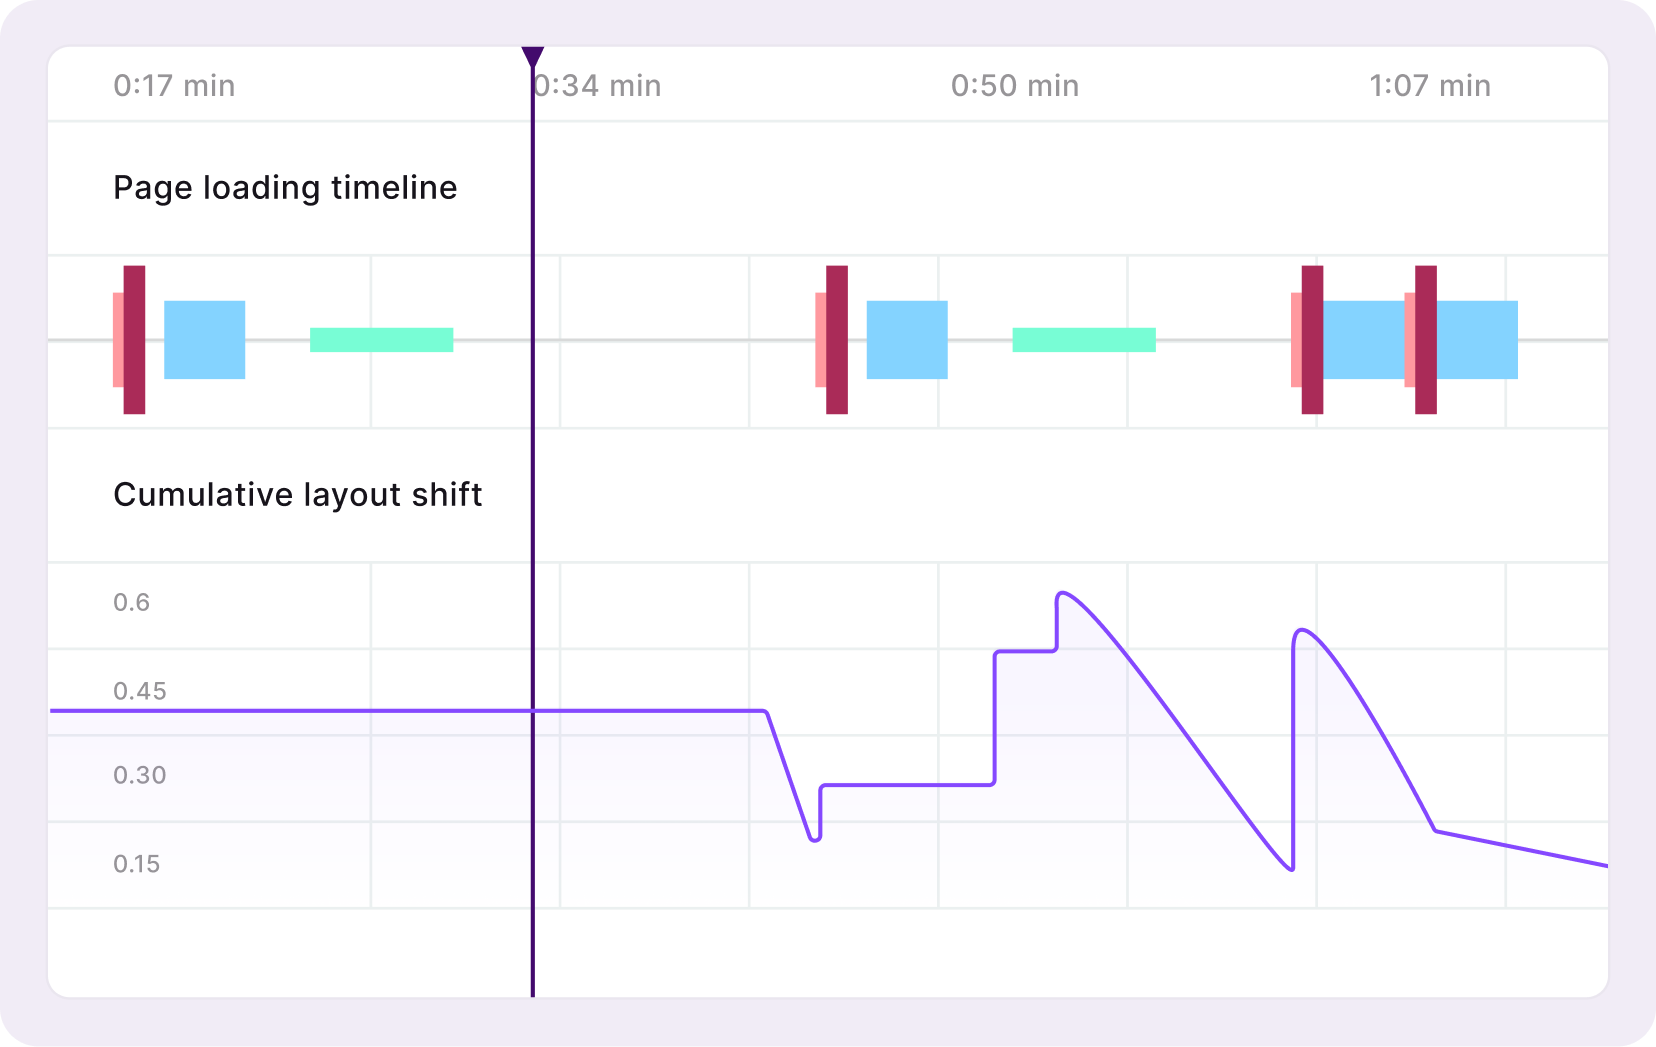
Web vitals
Track core web vitals — largest contentful paint, first input delay, cumulative layout shift, DOM complete, time to first byte, and crashes — at the session or aggregate level.
Learn more
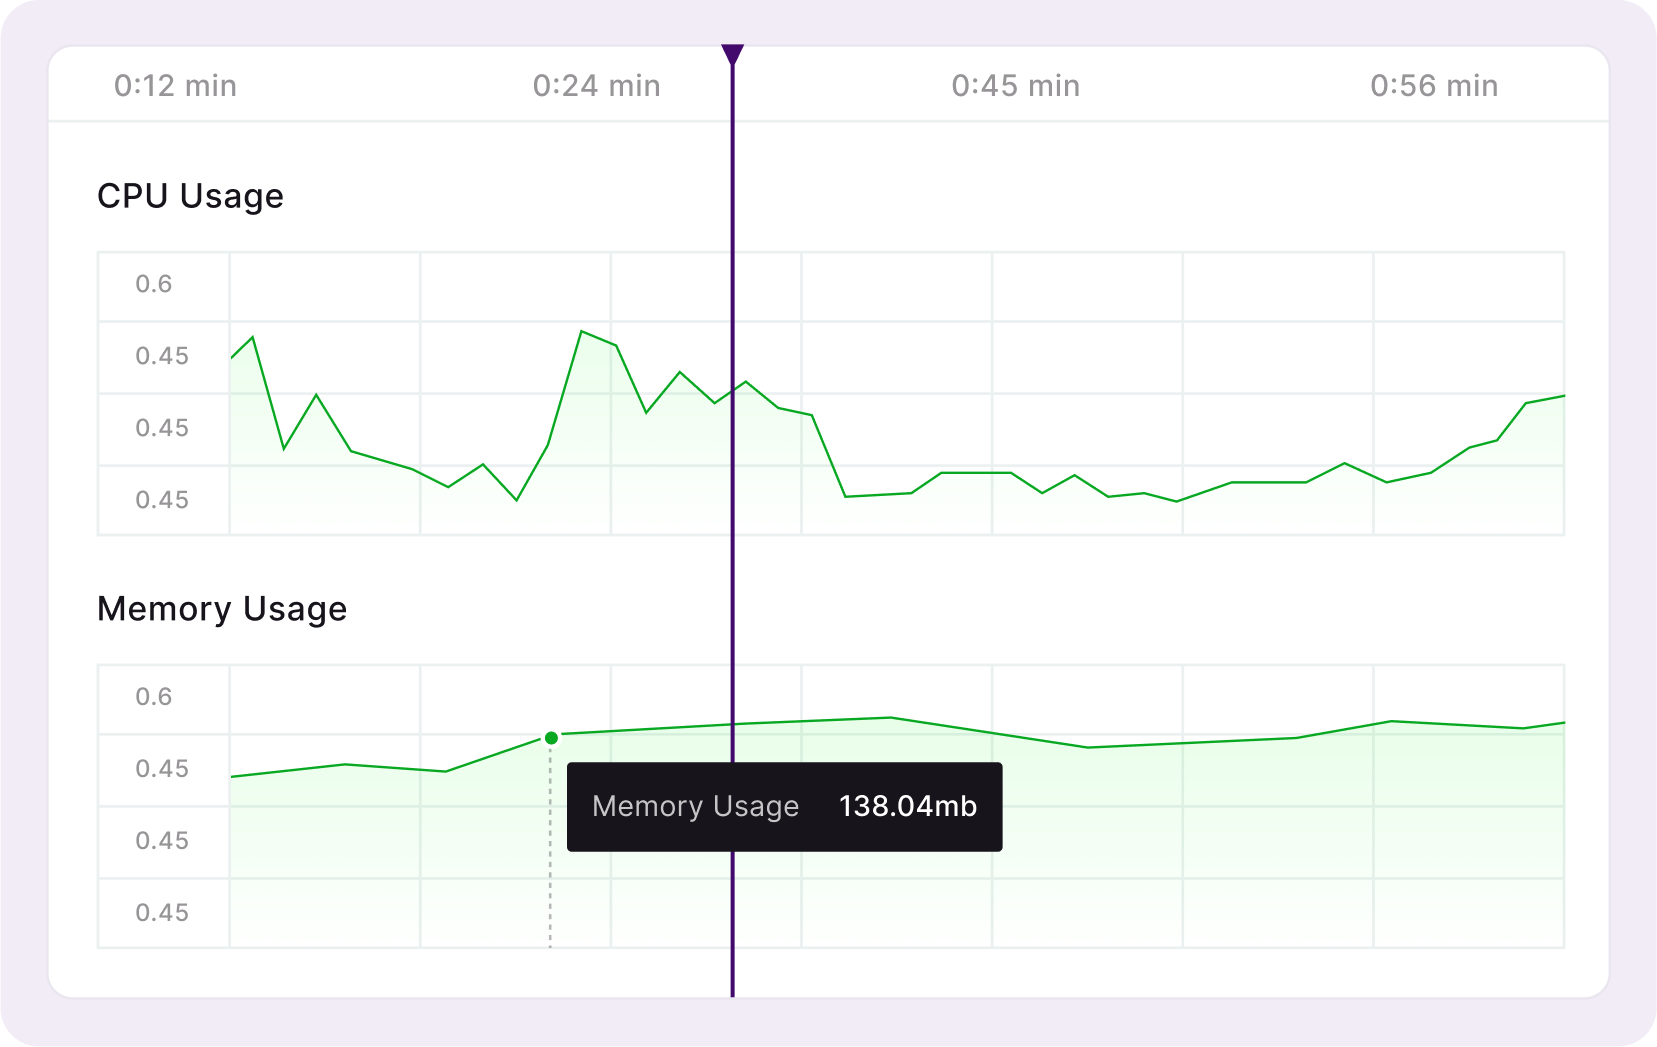
CPU & memory usage
Understand when CPU and memory usage spikes and the effect it has on user experience. Drill down into specific sessions to find the root cause of any memory leaks or spikes.
Learn more

Network speed, request duration & page load
Learn how connection speeds affect app performance and UX. Make adjustments that optimize user experience and internal KPIs.
Learn more
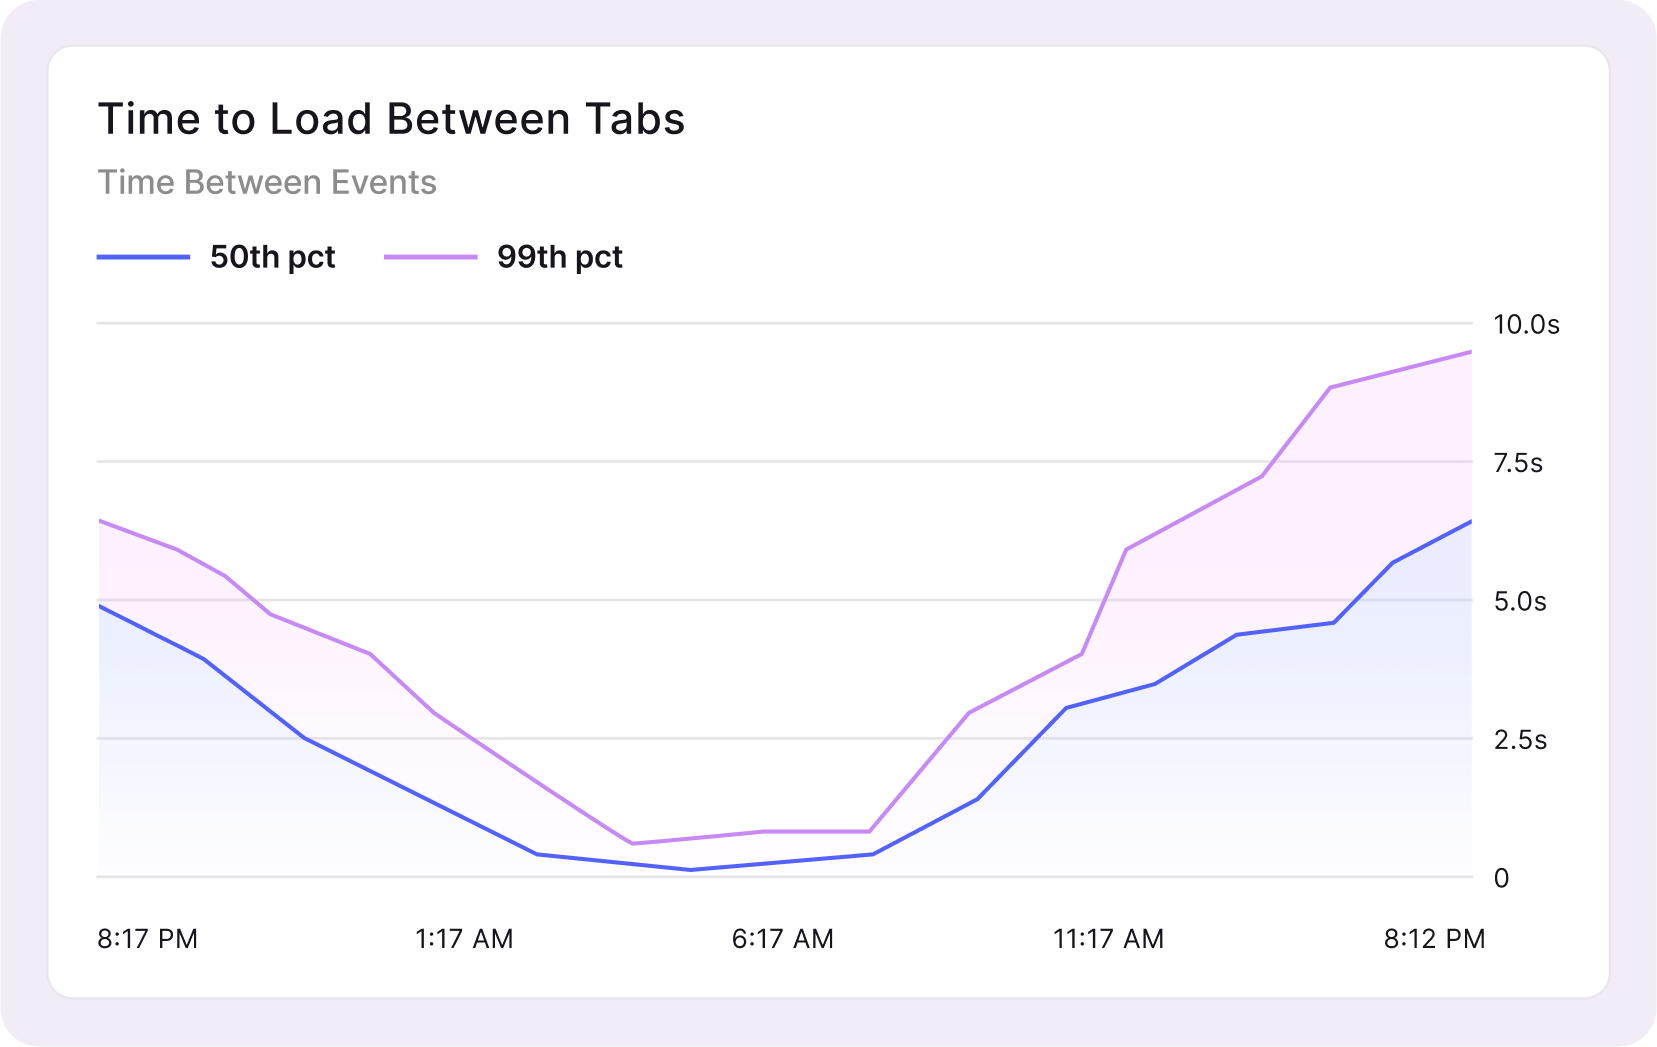
Tables & timeseries
Create charts to track any performance metric on a session, user, percentile, or conversion rate basis. Capture time between events for any two custom events, Redux actions, network requests, or navigation activities.
Learn more
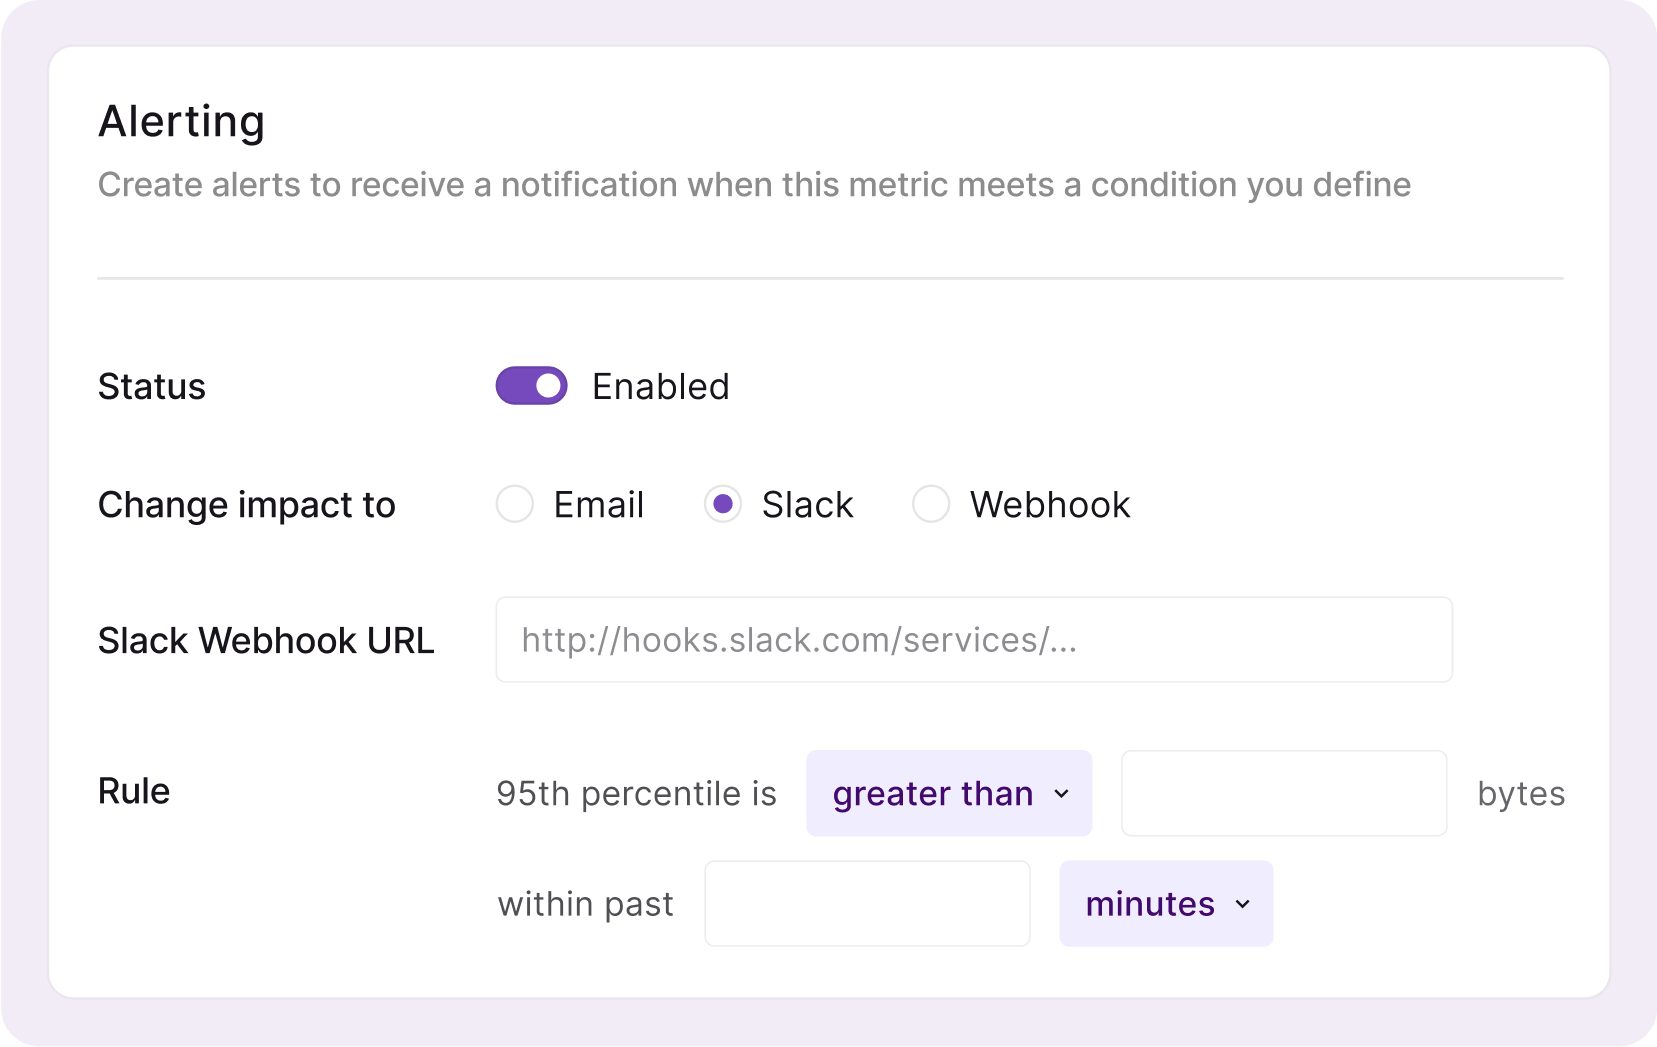
Alerting
Address web and mobile performance issues before they become pervasive. Send alerts via email, Slack, Pager Duty, or webhook whenever a metric exceeds or drops below a threshold you’ve set.
Learn more